Building fast, trustworthy UX for financial tools
In finance, a slow screen and a wrong number fail the same way: the client stops trusting the tool. What we learned building Tradeflow, a native trading-workspace study, about performance, money, order flows and where AI belongs.
Most UX advice is written for products where a delay is an annoyance. Financial tools are different. A trader watching a price move, a portfolio manager checking exposure or an operations analyst approving a reconciliation is making a decision on what the screen says right now. If the screen lags, stutters or shows a figure nobody can trace, the user doesn't file a bug — they stop relying on it, and go back to the spreadsheet.
To test what a genuinely fast financial interface takes, we built Tradeflow: a desktop trading workspace written in C11 on Raven, an open-source multithreaded GUI library that renders with Vulkan. It has a watchlist, a native candlestick chart, a paper-order ticket, portfolio and allocation views and an activity ledger — no browser, no Node, no network. Quotes and fills are simulated; nothing connects to a broker. The point was to find out what the interface itself costs, and what it takes to make one clients believe.
| Time | What you're watching |
|---|---|
| 0–7 s | Simulated quotes, candles, watchlist and account totals update together |
| 7–15 s | AAPL, TSLA and NVDA selected; chart switches 1W, 1Y, intraday |
| 15–19 s | Feed paused for two seconds — prices hold still — then resumed |
| 19–24 s | Five-unit NVDA paper buy is reviewed, then separately confirmed |
| 24–30 s | Portfolio and activity reflect the same fill |
| 30–34 s | Back to the workspace, with the measured results |
Performance is a trust feature
Clients don't experience your average frame time. They experience the one frame that hitched as the market moved, the blotter that froze for 200 ms while a garbage collector ran, the chart that redrew a beat after the price in the ticket. Those moments are rare, which is exactly why averages hide them. In a financial tool the tail is the product: the 99th-percentile frame is the one a trader remembers.
That reframes the performance question. It is not “is it fast?” but “can we say how slow it will ever be?” A budget you can reason about — every tick processed in well under a millisecond, every interaction reflected within a frame — is worth more than a fast median with an unexplained tail. In the Tradeflow recording, applying a quote to the account model and widgets took a median of 0.056 ms and 0.066 ms at P95: the spread between typical and worst is small, and that narrowness is the point.
Speed also has a quieter UX role: coherence. When a quote ticks in Tradeflow, the watchlist sparkline, the chart's last candle, the position's P&L, the portfolio value and the order ticket's estimated cost all change in the same frame. Nothing on screen disagrees with anything else. Clients read that consistency as correctness — and when it's missing, they start cross-checking the tool instead of using it.
Every Electron app ships a web browser
For a chat client, that's fine. For a blotter repainting 4,000 rows on every tick, it's a tax on every frame. A bundled-Chromium app runs its UI through a stack built for documents: DOM, style recalculation, layout, paint, compositing, a garbage-collected V8 heap and IPC between processes. Each layer is excellent at its job. None of them is under your control at the moment the market moves.
Raven's pipeline is shorter and explicit:
- A UI thread owns the widget tree. Nothing else mutates it.
- A render thread owns the GPU through Vulkan. Each frame is a self-contained packet, so the UI keeps working while it renders.
- Large subtrees are painted in parallel across cores.
- The application owns the loop —
while (Rdraw_frame()) { … }. You decide when a frame happens. In a browser runtime, the event loop does.
Screens are declared in XML and bound from C, C++, Rust, C# or Python, which matters in finance more than it first appears: quant and platform teams can share one front end, and the UI can call the same C/C++ pricing and risk libraries the back office uses, in-process.
Predictable tail latency. No garbage-collection pause or forced layout mid-market. Your p99 becomes something you can reason about.
Footprint. Raven's stripped library is about 1.3 MB with fonts. An Electron runtime is ~100 MB before you write a line — times every app on a four-screen desk.
Parallel rendering. Web workers can't touch the DOM. Native code paints, decodes and lays out on every core when data rates spike.
Smaller attack surface. No embedded browser engine with its own CVE cycle to explain to InfoSec.
Direct calls into pricing and risk. C/C++ libraries are called in-process: no serialisation across a JS bridge, no native-addon rebuilds.
Hiring and velocity. Web talent, devtools and component libraries are far deeper.
Memory safety is on you. ASan, TSan, fuzzing and review become mandatory. In finance, a crash is an incident.
Maturity. Raven's own README says its API is still changing. It is not ready for a production desk today.
GPU driver risk. Especially on locked-down VDI and Citrix images. Test on the real estate image, not a developer laptop.
Accessibility needs proving. Raven ships screen-reader support, but browsers have decades of hardening behind theirs.
Fast web front ends do exist — but the fastest ones end up rebuilding a renderer inside the browser, on a canvas or WebGL, and inherit the costs of both worlds. The honest framing is not native versus web. It's which screens justify owning the renderer.
Designing the screen clients will trust
Raw speed buys you attention. What keeps it is a set of interaction and data decisions that make the tool behave like the financial system it represents. These are the patterns we built into Tradeflow, and the ones we bring to client work regardless of the stack.
Money is integers, not floats
Every balance in Tradeflow is stored as integer cents. Purchases add exact cost basis; partial sales release proportional basis and book realised profit. 0.1 + 0.2 never reaches a client's screen.
Validate before you mutate
The account model checks cash, reserved units, quantity, price, instrument and ledger capacity before anything changes. A rejected order leaves the account exactly as it was — there is no half-applied state to explain.
Show what is committed, not just what is owned
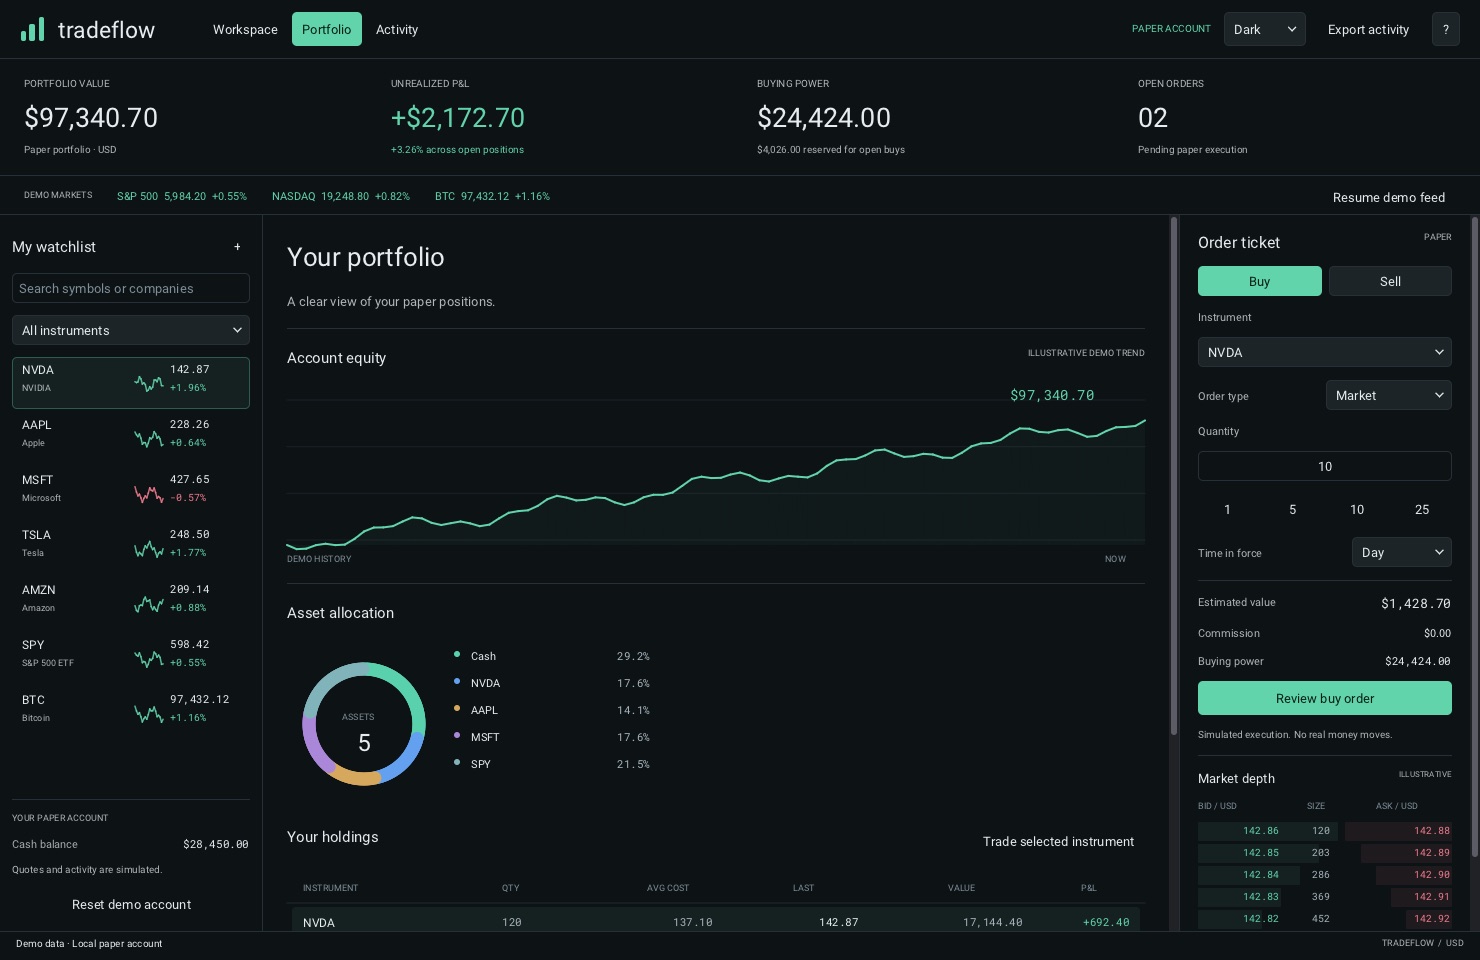
Working limit orders reserve their maximum cash. The header reads $24,424 buying power with $4,026 reserved, so a client never discovers the difference by having an order rejected.
Review, then confirm — as two separate acts
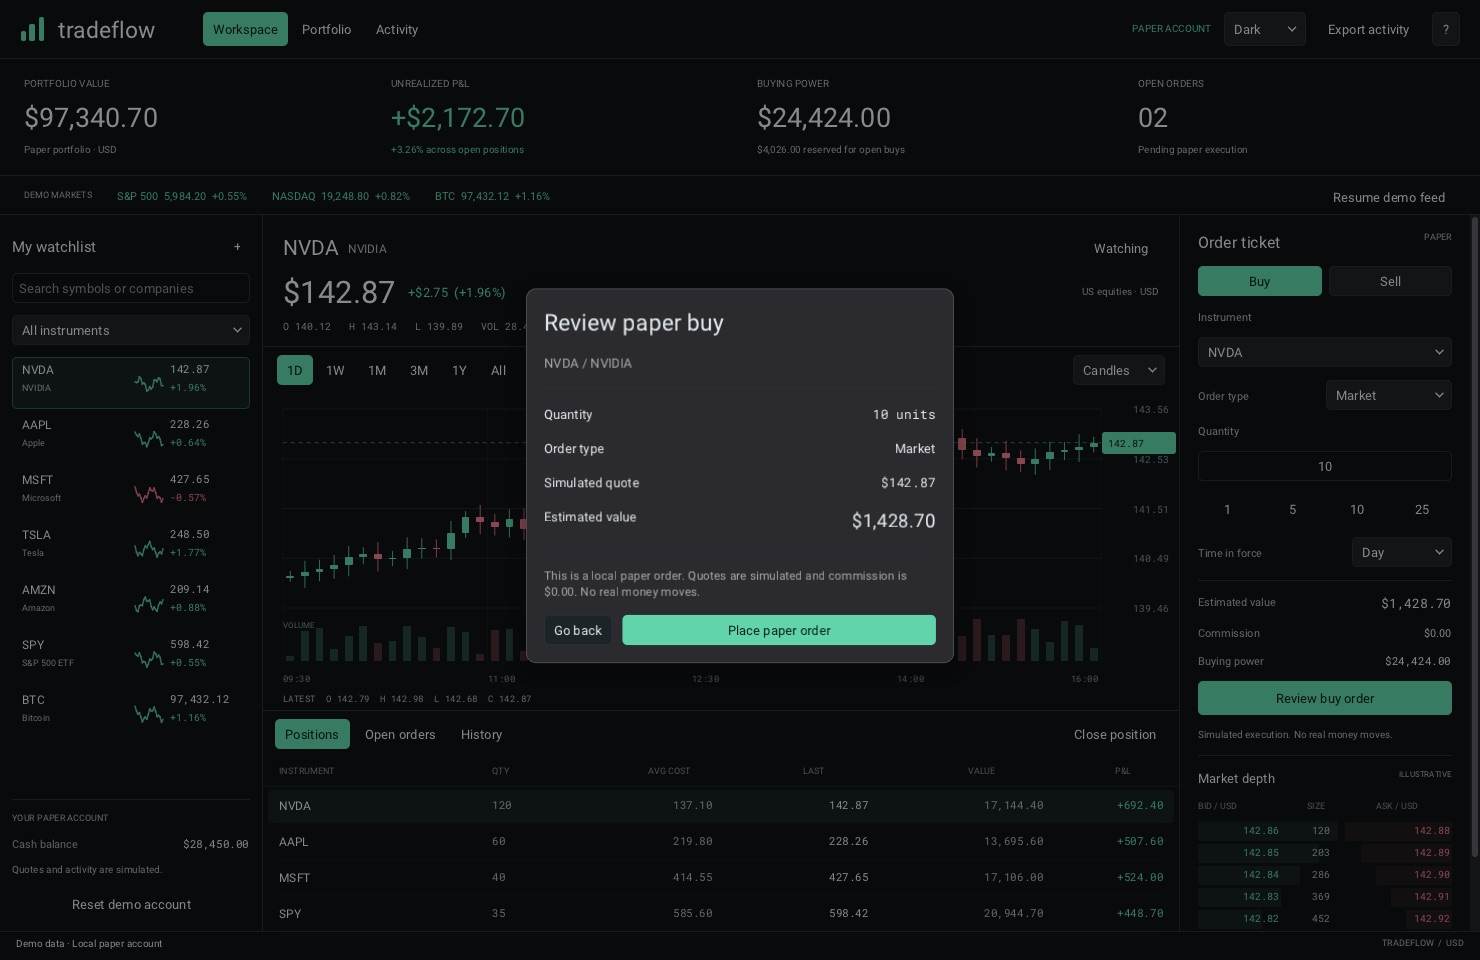
The ticket shows estimated value, commission and buying power as you type. A review dialog restates the order; only a separate “Place paper order” places it, and “Go back” is always one click away.
Label every number's provenance
“Paper account”, “Simulated execution. No real money moves.”, “Illustrative” on market depth and the equity trend. A client should never have to wonder whether a figure is live, modelled or decorative.
Freeze the world while a decision is open
Quote updates pause while a native dialog is open, so the price a client reviews is the price on the screen when they confirm.
Degrade by priority, not by squashing
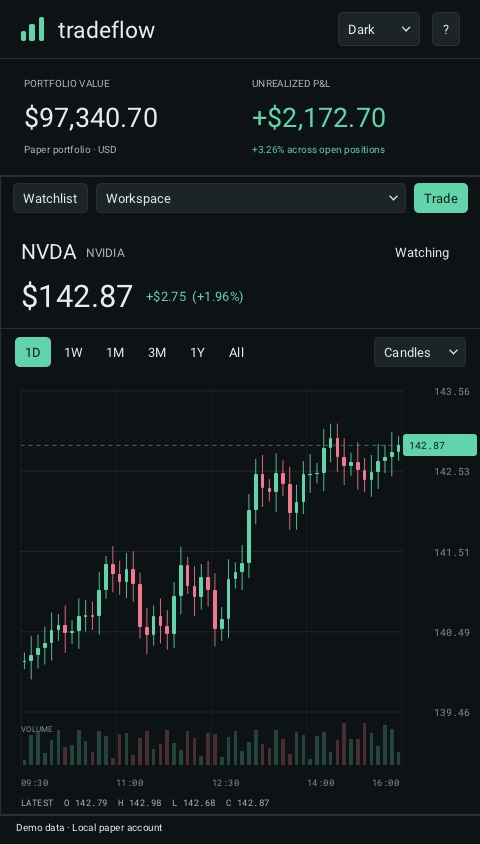
Below 1,240 px the watchlist becomes a toggled pane; below 930 px the ticket takes the full width; narrow windows simplify metrics and tables. Portfolio and activity stay reachable at 480 × 720.
Keyboard first, and named for assistive tech
Tables scroll and select with arrow keys, the chart is inspectable with left/right, F1 opens the guide, Ctrl+S exports the ledger. Inputs, watchlist rows and charts carry accessible names.
Density is a feature, noise is not
Financial users want a lot on one screen — the workspace shows four account metrics, a market strip, seven instruments, a chart with volume, positions, a ticket and market depth at once. Density works when the hierarchy is strict: one large figure per metric, tabular figures in a monospace face so columns align as numbers change, colour reserved for direction (green up, red down) and for the single primary action in each region. Nothing animates for decoration; motion is reserved for things that changed.
Responsive means re-prioritised
Financial tools increasingly run on a laptop on a train as well as a four-screen desk. The answer isn't to shrink everything. Tradeflow decides what matters at each width: the watchlist folds into a pane, the ticket goes full width, metrics simplify, and the lower table hands over to navigation. Its native UI test suite drives the app at 480, 768, 1,024 and 1,480 px so the layouts stay correct as the code changes.
AI that proposes, code that decides
In finance, “usually right” is a polite word for wrong. That is the tension in putting AI into financial tools: models are probabilistic; ledgers, settlements and regulators are not. The UX consequence is that an AI feature has to be designed as a proposal — visibly separate from the numbers the system stands behind.
So we build in two layers.
The model never moves money. It never posts a journal entry. It hands a proposal to code that can say no. Tradeflow's account model is that kind of code: it validates cash, reservations, quantity, price and instrument before any mutation, and 47 model checks pin down exact arithmetic, reservations, fills, basis and invariants. An assistant bolted onto it could suggest an order; it could not place one the model would reject.
The rules we hold to, and design the interface around:
- 01Every AI output is traceable to the document it came from.
- 02Every calculation is reproducible without the model.
- 03A human signs off wherever the regulator expects one.
- 04If the model is unsure, the workflow stops — it does not guess.
- 05Every input, output and override is logged, so an auditor can replay the decision.
- 06Measure how often it is wrong, not just how often it is right.
In the interface this means AI output always arrives with its source attached, uncertain results route to a person instead of resolving silently, and the safe path is the default when confidence drops. The fastest way to lose trust in AI is to ship it into a system that was trustworthy without it. Move fast on the parts that can be undone; move carefully on the parts that can't.
Measure honestly, and say what you didn't measure
Financial clients are trained sceptics, and a performance claim without a method reads like marketing. The Tradeflow recording ships with its raw per-frame samples, the executable's SHA-256 and the source commit, and states plainly what each number does and doesn't cover.
| Measurement | Median | P95 |
|---|---|---|
| Quote-update CPU work (market tick + widget refresh, excl. paint) | 0.056 ms | 0.066 ms |
| Synthetic native click → completed, GPU-read-back frame | 7.8 ms | 10.3 ms |
| Observed quote interval (feed threshold 850 ms, sampled at 30 Hz) | 867 ms | — |
One run · Apple M4 Pro · macOS 27.2 · 1480×960 window · 34 quote updates · 14 synthetic native mouse interactions · 12 warm-up frames before capture. Median and nearest-rank P95.
- Action timing is not click-to-photon. It runs from just before an injected native mouse event to a GPU-completed, read-back frame. It includes in-app dispatch, model and widget changes and rendering; it excludes physical input, OS delivery, compositor and display.
- 30 fps is the video, not the app. The recorder paces to wall time and repeats a frame when capture misses a deadline (3 of 1,020) so playback stays at 1×.
- The market is simulated. No exchange, network feed or broker is involved, so nothing here speaks to data freshness, execution latency or network throughput.
- It's a demonstration, not a benchmark. Startup time wasn't measured, and one machine is one machine.
That list is a UX artefact as much as an engineering one. Telling a risk committee exactly where a number stops being valid is how you get them to believe the rest.
Where we draw the line
Native for the hot path: order entry, market depth, blotters, real-time risk — the screens where the tail latency is the user experience and a frame of lag is a mispriced decision. Web for everything else: client portals, reporting, admin and onboarding, where reach, accessibility maturity and team velocity matter more than the last millisecond.
Whichever side a screen lands on, the trust patterns travel: exact money, validate-then-mutate, review-then-confirm, labelled provenance and AI that proposes rather than decides. If you are evaluating a native toolkit, treat it as infrastructure:
- 01Spike on your own data. Your instrument count, update rates and table sizes — not a demo feed.
- 02Profile on your own hardware, including the locked-down VDI or Citrix image your desk actually runs.
- 03Set a latency budget first, at P99, and fail the spike if it isn't met.
- 04Price in the safety work. Sanitisers, fuzzing, crash reporting and a manual accessibility audit are part of the cost, not extras.
- 05Keep the account model independent of the UI, so it can be tested, audited and reused whatever renders it.
The question isn't native versus web, or AI versus no AI. It's which screens justify owning the renderer, and which decisions are too important to leave to a probability.
Building a trading screen, client portal or finance-ops tool and want it fast and defensible? We can profile your hot path, prototype the critical screen, and design the line between what AI suggests and what your system decides.
// Keep reading
Pairing a classifier with a frontier language model across 52 hotel email use cases cuts modelled AI API costs by 56% against an optimised Claude-only design.
Choosing where AI belongs is an engineering trade-off across accuracy, cost, complexity and risk. A CXO framework for humans, rules, machine learning and generative AI.
What pre-training, post-training and evaluation involve — and what they mean for compute, data governance and talent decisions in Ireland and the EU.